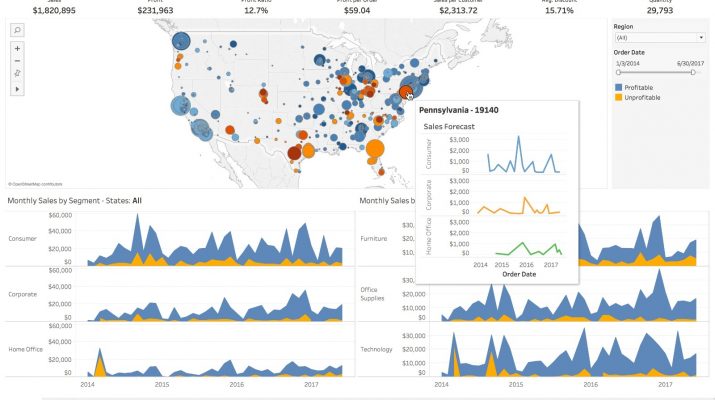
Tableau is a visual analytics platform transforming the way we use data to solve problems—empowering people and organizations to make the most of their data.
Data has limitless potential to transform businesses and the world—as long as people are empowered to use it. Tableau helps people drive change with data. Tableau helps people and organizations be more data-driven. Tableau helps people see and understand data.
Tableau, which has a place in the market with many products such as Tableau Desktop, Tableau Server, Tableau Online, is one of the very young brands that stand out with its ease of use and develop solutions quickly.
Tableau, with its free version and rich and interactive data visualization possibilities, is one of the indispensable tools for those interested in data visualization. As a business intelligence software, Tableau is used for data analysis and data visualization in many fields from private companies to public institutions.
With the Tableau Public version, we can share data visualization studies on the internet. In addition to being able to add the work to our site interactively, we can also download it in png, jpeg or pdf formats if we wish.
Tableau makes it possible to create customized solutions on their own without trapping users in specific plots. In this way, the experience outputs focus not on what solutions the application produces, but on what solutions the users can produce thanks to the application. In this way, it is possible to reach more creative and effective solutions.
To summarize the features Tableau offers, it is very easy to learn and use, and you can easily find solutions to the problems you may encounter or get support from the user community. With Tableau products, which contain many features to produce creative outputs, you can evaluate costs more effectively in the business intelligence investment process.

